
Analytics
Know which Contexts and Workflows your team actually runs.
Track MCP and API usage over time, filter by Context or Workflow, and drill into token and cost signals.
Oi Analytics gives organization leaders a shared view of how installed Contexts and Workflows are used in production. See what is gaining traction, where token spend is concentrated, and how guardrail-heavy workflows are behaving before rollout issues spread.
Compare MCP versus API usage for a launch-planning Workflow over the last 30 days.
Find the Contexts with the highest prompt-token volume before renewing client licenses.
Review guardrail activity alongside usage to see which policy patterns are getting exercised most.
In the app
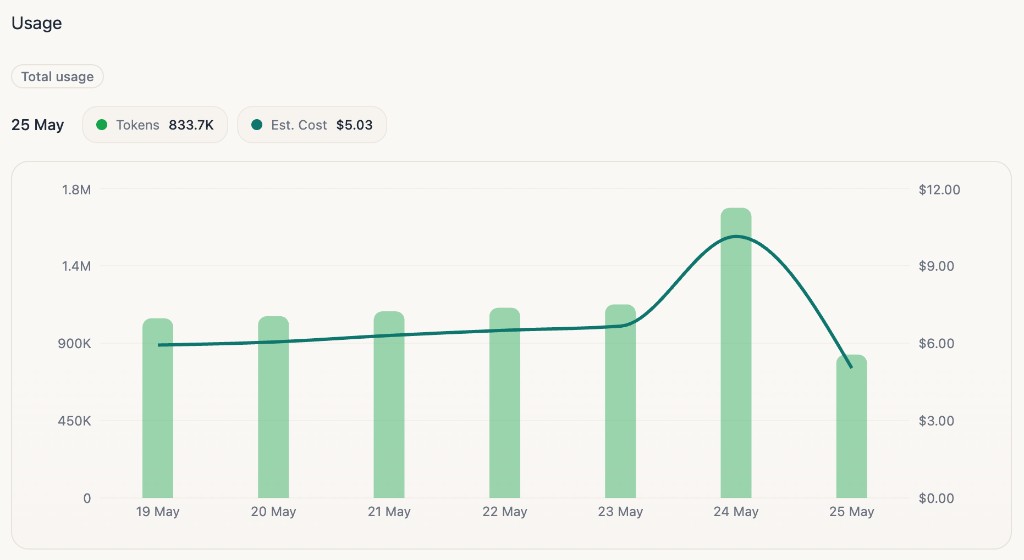
One analytics surface for the assets your team installs.
The dashboard Analytics view is built for operators who need adoption and spend signals without exporting logs from every client. Filter the same org-wide dataset your MCP and API traffic already feeds.
How it works
From raw usage events to decisions your team can act on.
See usage across MCP and API
Track how your team loads Contexts and Workflows through MCP clients and the organization API in one place.
Filter to what matters
Slice by date range, source, and specific Context or Workflow so leaders can focus on the assets driving real work.
Understand token and cost signals
Review prompt, output, cache, and compression totals with coverage badges that explain when numbers are reported versus estimated.
Spot guardrail pressure early
Pair usage trends with guardrail activity so teams can see when policy-heavy workflows are getting heavier before rollout issues show up elsewhere.
What you can measure
Usage, tokens, and guardrail signals in one org-wide view.
Usage over time
Chart MCP and API activity across today, the last week, or longer windows your team cares about.
Per-asset drill-down
Sort and search the Context and Workflow table to see runs, tokens, estimated cost, and last-used timestamps.
Org-level visibility
Give admins and leads a shared view of what is actually being used instead of guessing from chat history.